1. Motivation
Airborne LIDAR has become a standard remote-sensing tool in archaeology because of one property optical imagery lacks: a single laser pulse can return multiple times as it passes through vegetation canopy before hitting bare ground, letting a classified point cloud be filtered down to a "bare-earth" elevation model with the trees and undergrowth digitally stripped away. This is the same property behind well-known LIDAR-driven discoveries of settlement networks hidden under dense forest canopy in Mesoamerica and Southeast Asia — the structures were never truly hidden underground, only hidden from optical sensors by what was growing on top of them.
Raw elevation alone, however, rarely shows anything useful: a building foundation reduced to a few centimeters of relief is invisible against natural micro-topography and sensor noise at normal color scales. The techniques below — long established in archaeological remote-sensing literature — exaggerate exactly that kind of small local relief, turning elevation data most people would dismiss as "just a flat field" into a map of what used to stand there.
2. Methods
2.1 Data acquisition
Input can be a user-supplied DEM GeoTIFF, a ground-classified LAS/LAZ point cloud (gridded via linear interpolation over the classified ground returns), or a place name or coordinate pair, geocoded via OpenStreetMap/Nominatim and fetched directly from whichever national survey covers it — USGS's 3D Elevation Program (3DEP) in the US, the Environment Agency's LIDAR Composite in England, Kartverket's national height model in Norway, AHN in the Netherlands, GUGiK's NMT in Poland, Toitū Te Whenua LINZ's national DEM in New Zealand (CC BY 4.0) and the Scottish Government's LIDAR in Scotland (Open Government Licence, Crown copyright Scottish Government), each at 1 m — with no manual download step and no API key required.
2.2 Terrain visualization derivatives
Four derived products are computed from the DEM:
- Multi-directional hillshade — simulated illumination averaged over eight sun azimuths, reducing the single-light-direction bias of a conventional hillshade.
- Slope — steepness at each cell, in degrees.
- Local Relief Model (LRM) — the DEM minus a Gaussian-smoothed copy of itself, isolating small local bumps and depressions from the broader regional terrain trend.
- Sky-view openness (positive and negative) — the mean horizon angle across several compass directions at each cell; positive openness highlights convex features (mounds, walls), negative highlights concave ones (pits, ditches, sunken paths), independent of any single simulated light source.
These four are fused into an RGB composite (openness channels plus hillshade) in which man-made geometry tends to separate visually from the more textured, irregular signature of natural terrain.
2.3 Candidate detection
The LRM is thresholded against local background noise (mean ± k standard deviations) into "raised" and "depressed" binary masks, which are then processed with OpenCV contour extraction. Each contour is scored for rectangularity (contour area over minimum-bounding-rectangle area) and circularity (4π·area / perimeter²) — shapes clearing either threshold are classified accordingly; the rest are kept as lower-confidence "irregular" candidates. Shape score alone is a poor sort key, because a blob a few pixels across fills its own bounding rectangle exactly and so scores a perfect 1.0 by construction. Ranking therefore weights the shape score by a log-normal size plausibility, peaking around a building-sized footprint and falling away toward both specks and hillside-sized landforms.
Shape and size still only describe an outline. Whether the ground inside it was worked is answered by the floor profile: a dug cellar or a levelled pad sits at roughly one depth, so most of its interior is near the extreme, while a natural hollow ramps continuously and only a small core gets there. Each candidate therefore also reports depth and a "floor flat" fraction — the share of its interior within 75% of its own peak relief. The measure is scale-free and the geometry supplies its own reference points: a flat-floored pad approaches 1.0, an ideal paraboloid basin scores 0.25, a cone 0.06. It is computed on the elevation model against a quadratic trend surface fitted to a ring just outside the feature, which removes both regional slope and curvature; measured on the Local Relief Model instead it is meaningless, for the reason in the note below. Where relief falls below about three times the local noise floor, no value is reported rather than a misleading one. Floor flatness is the third term in the ranking, and across 693 candidates from a real forested scan its median was 0.25 — precisely the paraboloid figure, i.e. most terrain reads as terrain.
Those measurements are then read into a plain-language interpretation — "possible cellar hole or dug foundation", "linear cut — possible mill race, ditch or sunken lane", "bowl-shaped — reads natural" — with every label gated on the evidence supporting it. Long thin earthworks are classified before house-shaped rules get to them, since a race bank and a building footprint are distinguished by aspect ratio and by whether the top is flat rather than by outline alone. Anything failing the gates is named as unclassified rather than given a flattering guess; on the scan above that was 627 of 693.
3. Validation against synthetic ground truth
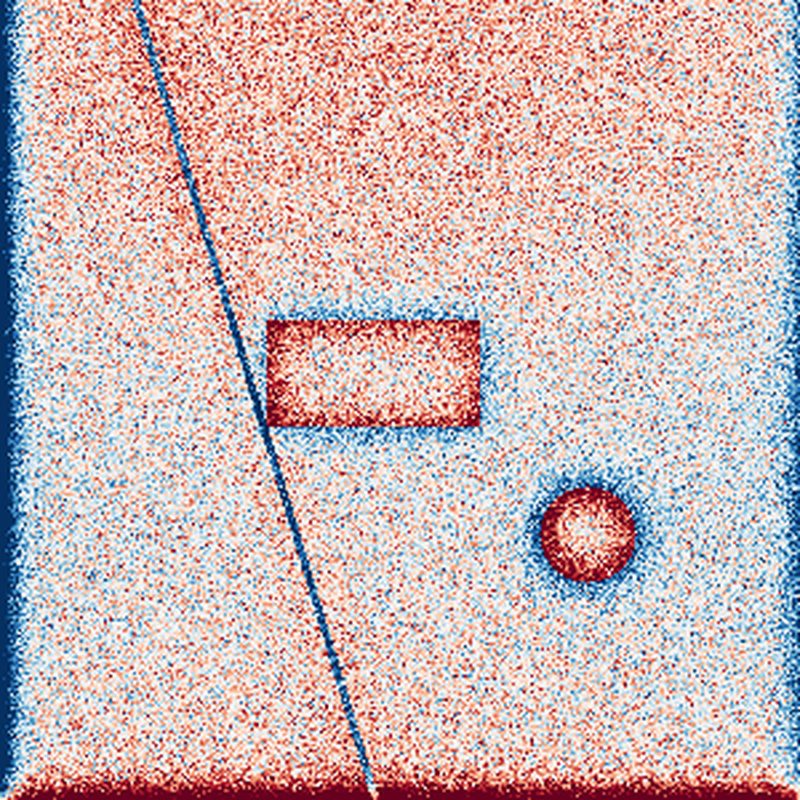
Before trusting the pipeline against real data, we generated a synthetic DEM — rolling terrain plus Gaussian noise — with three known structures embedded at known locations: a 40 × 20 m rectangular raised foundation, an 18 m-diameter circular raised mound, and a diagonal sunken linear ditch. The detection pipeline was run blind to these ground-truth positions.
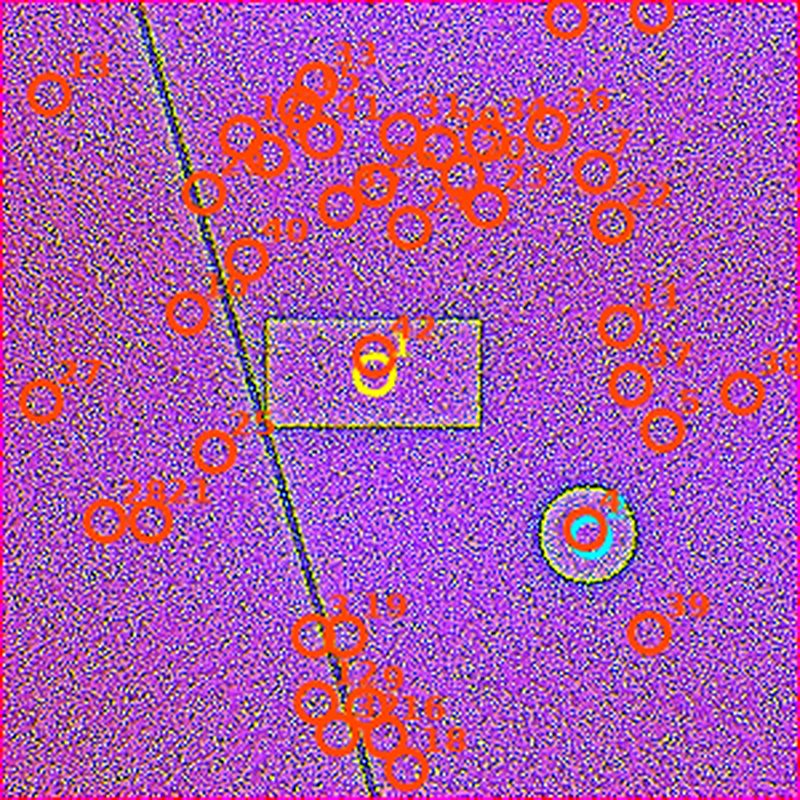
| Rank | Shape | Detected area | True area | Detected size | True size |
|---|---|---|---|---|---|
| 1 | circular | 238 m² | ~254 m² | 17.7 m dia. | 18 m dia. |
| 2 | rectangular | 751 m² | 800 m² | 20.0 × 39.5 m | 20 × 40 m |
Both embedded structures were recovered as the top two ranked candidates, with size and location matching ground truth closely. Remaining candidates in the ranked list are false positives driven by the synthetic terrain's random noise floor — expected, and consistently ranked below the true structures by confidence score.
4. Case study: Gettysburg, PA
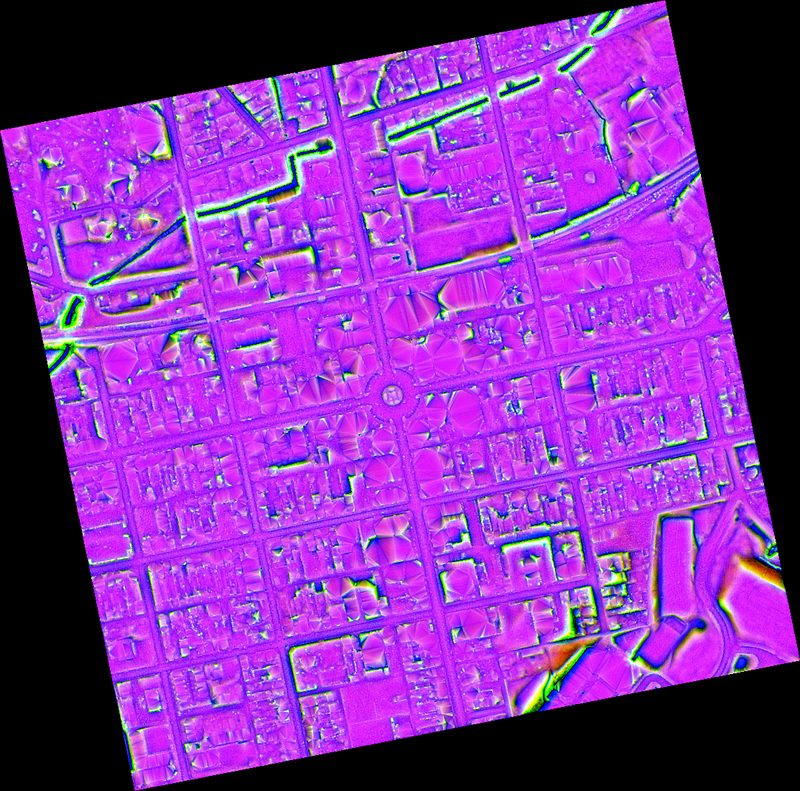
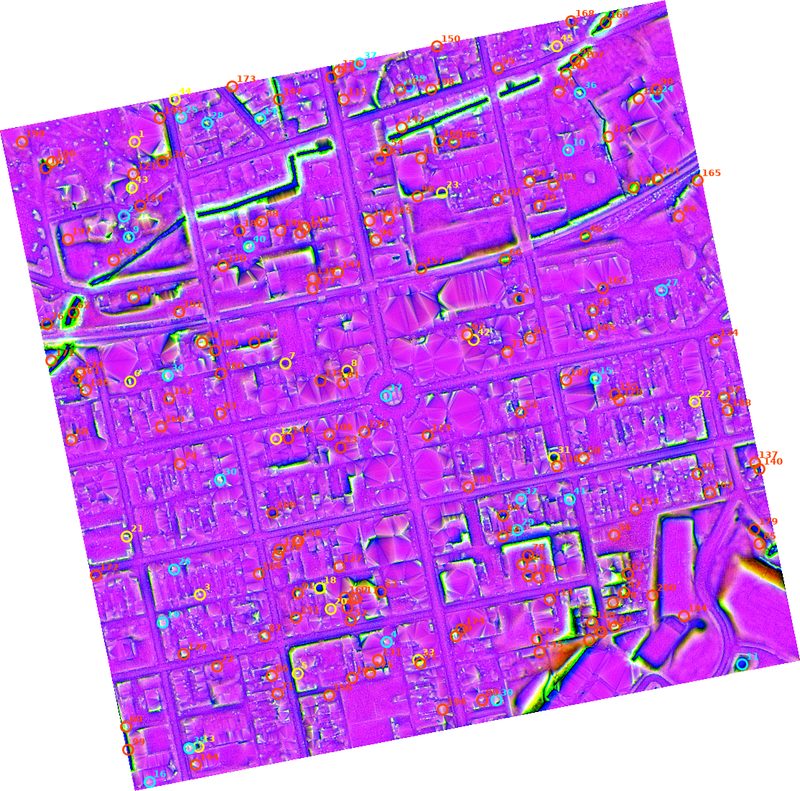
To test the pipeline against real, auto-fetched LIDAR data, we ran it against an 800 × 800 m area centered on downtown Gettysburg, Pennsylvania, at 1 m resolution, fetched automatically from USGS 3DEP by place name alone.
5. Present/past comparison
Once a candidate location is identified, the next question for a hobbyist is: where does that map onto the world as it actually looks today? Lidarman builds a "blink comparator" — the same technique astronomers have long used to spot a moving object by flashing two photos of the same sky back and forth — that flashes between a present-day satellite image and the LIDAR past-structure composite, aligned pixel-for-pixel, in real time. In the web application this is a live map overlay; the CLI additionally emits a standalone, self-contained HTML file for offline viewing.
The comparison also runs the other way, against the documentary record rather than the terrain. The web application can lay any sheet from the USGS Historical Topographic Map Collection — every quadrangle the survey ever printed, back to 1884 — over the same view at adjustable opacity. This matters because a terrain anomaly and a cartographic one are independent kinds of evidence: the detector can only report that the ground holds a rectangular depression of a plausible size with a flat floor, whereas a black square inked on that spot in 1902 reports that a surveyor stood there and saw a building. Either alone is a candidate. Together they are a target, and the distinction is the difference between a day spent walking and a day spent digging.
6. Interactive web application
A Leaflet-based map interface runs over the same pipeline described above:
- Search by place name or coordinates — runs the full fetch → derive → detect pipeline server-side
- Candidate markers colored and ranked by shape/confidence, with details on click
- Real-time flicker toggle (or space bar) between the live satellite basemap and the past-structure overlay
- Switch the overlay between the composite, hillshade, slope, and local-relief color styles without re-running the search
- Lock the map's zoom level once you've framed the view you want, so panning around can't accidentally change it
- Click anywhere to name and save your own flagged location, persisted locally across sessions
- Each candidate reports its dimensions, orientation, depth, floor flatness and coordinates, with a plain-language reading of what the measurements support
- A QR code on every candidate, so a spot found at a desk can be opened on a phone in the field without typing coordinates
- "Parks near me" lists named parks within 50 miles of your location as somewhere to point a scan, nearest first
- Candidates falling on National Park Service, National Forest or BLM land are labelled as such, checked live against the managing agencies' own boundary services
- Historic USGS topographic sheets — the full Historical Topographic Map Collection, roughly 180,000 sheets back to 1884 — laid over the map at adjustable opacity, listed oldest first for wherever the map is centred, each linking to its original full-resolution georeferenced scan
7. Get access
Lidarman runs on a server, not on your phone. Every search pulls fresh elevation data for your spot and processes it, which takes real time and real compute — that's why it isn't just a file you download once. Try it free — search the demo places as often as you like, then a one-time $25 payment unlocks the tool on that device, no subscription. There's a fair-use limit of 100 searches a day on paid devices — far more than anyone hunting real ground will use, and it's only there to stop a script hammering the server on one payment.
8. Limitations & future work
- False positives are expected. Natural terrain noise, vegetation edges, and shadow artifacts can score high enough to be flagged. Auto-detection is a starting point for narrowing a search area, not a verdict — always cross-check the composite/overlay images directly.
- Large flat features need parameter tuning. The morphological-closing kernel (§2.3) must be sized relative to the smallest feature you expect; a mismatch fragments detection results.
- DEM quality varies by location. Urban "bare-earth" products aren't always guaranteed to exclude standing structures; rural agricultural or forested sites are typically cleaner test cases.
- Roadmap: weighting/ML-based confidence scoring beyond pure geometric heuristics, non-US data source support, and packaging for wider distribution.
No legal or jurisdictional restrictions are built into the tool itself — where it is or isn't appropriate to search with the results is entirely the responsibility of the person using it, the same as any other detection or survey equipment.
9. FAQ
Does Lidarman work outside the United States?
Yes — England, Wales, Scotland, Norway, the Netherlands, Poland and New Zealand. Search a place in any of them the same way you'd search a US one and you'll get the same 1 m detail, because each runs on that country's own national lidar survey rather than a coarse worldwide one.
Nowhere else yet. Each survey stops at its own border, so Northern Ireland isn't covered even though the rest of Britain is. Scotland's lidar doesn't reach every spot yet either; its national programme is still flying new areas. If you search somewhere with no coverage, Lidarman will say so rather than hand you a blank map.
Protected sites are flagged in all six. Each country's own register does it — the National Park Service in the US, Historic England's Scheduled Monuments, Cadw's in Wales, Riksantikvaren in Norway, the rijksmonumenten register in the Netherlands and Poland's registered archaeological monuments. Land a candidate on one and it's marked, with the monument named where the register gives a name.
That's a floor, not a clearance. None of it replaces the landowner's permission, and Poland expects a conservator's permit for detecting anywhere at all, not just on a registered site.
How much does Lidarman cost?
Searching the demo places is free and unlimited, no account required. To search anywhere else, a one-time $25 payment unlocks that device — no subscription, no recurring charge, with a fair-use ceiling of 100 searches a day.
What is LIDAR, and why does it reveal things aerial photos don't?
LIDAR measures ground elevation directly by bouncing laser pulses off the surface from an aircraft, dense enough to filter out tree canopy and see the bare earth underneath. A collapsed foundation or filled-in sunken path can be completely invisible in a satellite photo — flat color, no shadow — while still showing up as a few centimeters of elevation change once you process the bare-earth model the right way (§2.2).
Do I need a metal detector to use Lidarman?
No. Lidarman only narrows down where to look — it doesn't detect metal itself. It's built with detectorists in mind, but the output is just as useful to anyone scouting old sites on foot.
Does a flagged candidate mean something is definitely there?
No — treat candidates as a starting point, not a verdict. See Limitations (§8) for the specific failure modes (terrain noise, vegetation edges, large flat features) worth knowing before you commit to digging a spot.
Is it legal to search a location Lidarman flags?
Lidarman doesn't build in any restriction on where you search — that responsibility is entirely yours, same as owning a metal detector doesn't make every location legal to use one on. Check land ownership and local/state rules before you dig — see permission and legal basics for the general ground rules, including a note about the battlefield presets in the tool above.
Field guides: Historical maps for metal detecting · Finding old homestead sites with LIDAR · LiDAR hillshade maps for metal detecting · Permission and legal basics · all guides →